Flowcharts easily make it possible to describe progress of operations, activities, their sequence or even fundamental relations among them. Thus, each process or activity is made transparent and simplified.
History of flowcharts
Contrary to a traditional belief, flowcharts were not first utilized with the development of computing and the need to simply illustrate what goes on inside of the computers, but their beginning dates back much further. As early as in 1921, Frank Gilbreth introduced his work entitled “Process Charts—First Steps in Finding the One Best Way” as the result of his efforts to eliminate needless movements and activities while laying bricks. For Frank Gilbreth was a bricklayer. Exploitation of flowcharts then began where we now want to demonstrate its benefits in searching for optimum processes. The development of computers only enhanced people´s awareness of their usage and expanded the spheres of their application.
What is a flowchart
A flowchart is a simple tool which, while utilizing a number of elementary graphical symbols, describes development of an activity / process in a time sequence.
Elementary symbols include:
- Start / End – if we want to monitor an operating step, for instance, first of all we have to establish the limits within which we are going to follow that operating step. The reason for this is to find a proper scale and depth of description.
- Process step, activity – a symbol that will enable us to communicate what successive steps in a given process exist.
- Sequence, linkage – the symbol of an arrow shows us flow and sequence of the individual steps.
- Decision – nearly always, in each process, it comes to the situation when a decision has to be made as based upon a criterion whether a change in a process should be effected or not (for example, a sufficient quantity of material in stock, a document approval time-limit elapsed).
- Inputs / outputs – there cannot be a process that has no input and that creates nothing at the same time, therefore, there are also symbols reflecting this, for instance, a symbol for a document / record.
There are other symbols too, as the broad issue of creation and description of flowcharts has been standardized, nevertheless, the aforesaid elementary symbols should do.
Purpose and application of a flowchart
You may find the following situation familiar – from an overview you discover that components for production of some equipment have repeatedly been purchased and sold several times. You call your purchaser to ask what is going on - he or she will tell you what happened and how it happened: how they had to see the supplier due to repeated changes in the specification. You call at the designer who will tell you there is just one specification still deposited in place X, and they do not know why the purchaser has not purchased it yet. On your way back you meet the foreman who will inform you he had to alter the specification, as the purchaser bought some weird components they had never been using before. And so you call together the purchaser, the designer and the foreman and have them describe what and how they do. There will be a mess, as each of them describes their actions differently – the way they are used to do their work. We are not going to resolve what is right or wrong here, instead, let us show what is the best course of action right now – having a word with the designer, the purchaser and the foreman and specify the right steps to take and the subsequent actions.

The Real | Interim Manager for Your Changes

Manager work model

Time management - making use of time effectively
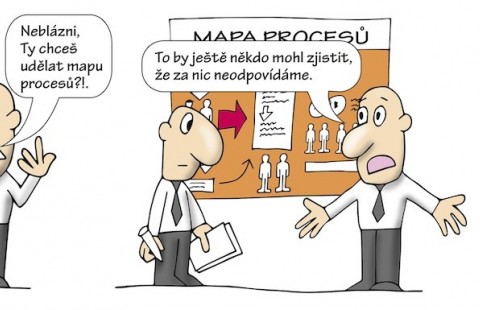
Jak správně tvořit mapu procesů

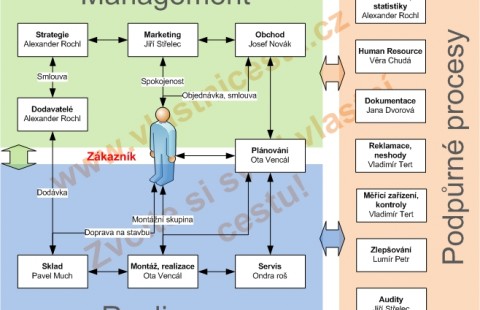
Modelling and setting the processes and procedures - ISO 9001

Training - preparation of the SWOT analysis and strategy
Company Management System of Quality Step by Step - ISO 9001
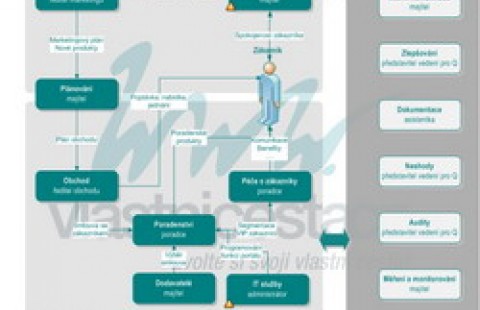
Process map acc ISO 9001 - business offer

IT staff communication
Specification of steps can be performed in a number of ways:
- verbal description in the form of points, where we only say how things should be done (and what usually is the cause of the above problem)
- verbal description in the form of a written essay-style document, which is usually not very well-arranged for practical use
- a table, where there is usually a problem with establishing more complex sequences, or
- a flowchart which is simple and well-arranged.
A description in the graphical form is normally very well arranged and easy to remember by whoever it is intended for. If it is well arranged, then it is also much easier to follow what could be changed and what could be done faster, more simply – in short, to optimize the described process. Subsequently, any changes can be prepared very easily, as you can see instantly what you alter and how.
Types of flowcharts
As time goes on, the typology of flowcharts classified by the way they are being used has stabilized as follows:
- work flow diagram
- cross-process flowchart
- elementary flowchart
- IDEFO diagram
- SDL diagram
- data flowchart
It is therefore possible to choose the type which suits best your situation and circumstances.